Mastering Data Viz: Simplify Complex Info in 2024

Data visualization has become a crucial skill in today's data-driven world.
With the abundance of information available, simplifying complex data into easy-to-understand visuals has never been more important.
Mastering data viz can help individuals and organizations make better decisions by quickly understanding patterns and insights within large datasets.
Quick Summary
- Complex data visualization requires careful planning: It's important to identify the key message and audience before creating a visualization.
- Choosing the right chart type is crucial: Different types of data require different types of charts to effectively communicate the message.
- Color and design can enhance or detract from the message: Use color and design elements intentionally to highlight important information and avoid clutter.
- Interactivity can improve understanding: Interactive elements can allow users to explore the data and gain a deeper understanding of the message.
- Accessibility is important: Consider how users with disabilities will interact with the visualization and ensure it is accessible to all.
Introduction To Data Viz
Discover the Power of Data Visualization
Are you drowning in a sea of data?
Do you struggle to find the information you need?
Look no further than data visualization
This powerful tool simplifies complex information by presenting it visually.
Let's explore its basics and effectiveness.
What is Data Visualization?
Data visualization creates clear, concise representations of large amounts of information using charts, graphs, diagrams, or maps.
The goal is to recognize patterns easily while reducing time spent analyzing raw numbers on spreadsheets.
The Benefits of Data Visualization
- No more relying solely on written reports
- Better understanding relationships between variables for decision making
- Fast comprehension
“Data visualization is a powerful tool that can help you make sense of complex information quickly and easily.”
With data visualization, you can say goodbye to the days of sifting through endless spreadsheets and written reports.
Instead, you can quickly and easily identify patterns and relationships between variables.
This allows for faster comprehension and better decision making.
“Data visualization is the key to unlocking the power of your data.”
Don't let your data overwhelm you.
Embrace the power of data visualization and unlock its full potential.
Analogy To Help You Understand
Complex data visualization is like a symphony orchestra.
Just as an orchestra is made up of different instruments, each with its unique sound and role, complex data visualization involves multiple data sets, each with its own characteristics and importance. Just as a conductor leads the orchestra, a skilled data analyst guides the visualization process, ensuring that each data set is properly represented and that the overall message is clear. Just as a symphony can evoke different emotions and tell a story, complex data visualization can reveal patterns and insights that might not be apparent from a single data set. Just as a symphony requires practice and rehearsal to achieve a flawless performance, complex data visualization requires careful planning and testing to ensure accuracy and effectiveness. And just as a symphony can be enjoyed by both casual listeners and music experts, complex data visualization can be appreciated by anyone who wants to gain a deeper understanding of the world around them.Benefits Of Simplifying Complex Info
Simplifying Complex Data: The Key to Effective Visualization
When it comes to data visualization, simplicity is key.
Simplifying complex data not only aids audience comprehension but also offers several benefits.
Save Time and Prevent Confusion
By simplifying data, you eliminate the need for lengthy explanations or clarifications, saving time for both you and your audience.
Additionally, simplification prevents confusion and misinterpretation of information, ensuring that your message is clear and concise.
Improve Retention and Understanding
Using simple language and graphics creates a unified understanding between all parties involved in analyzing results.
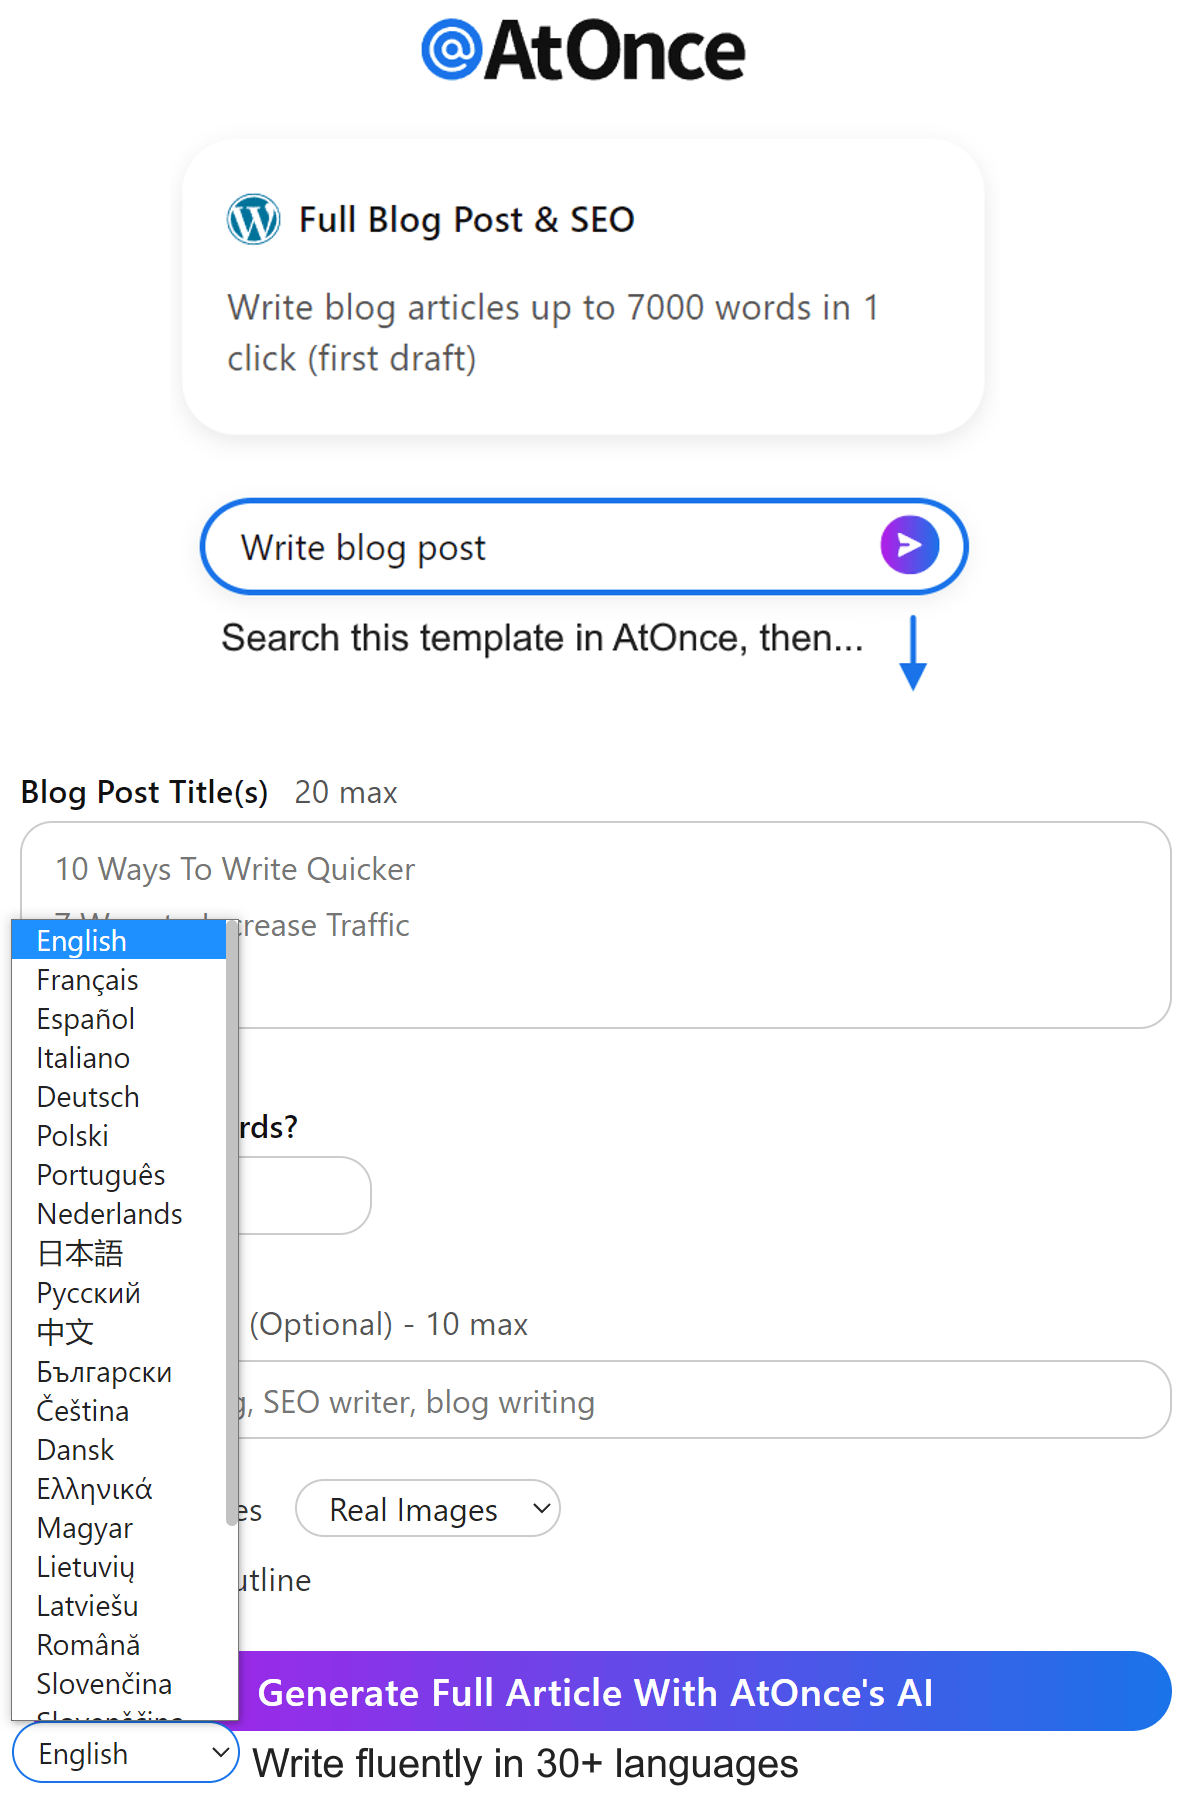
I use AtOnce's AI language generator to write fluently & grammatically correct in any language:
Simplified visuals improve retention and understanding among viewers over time, making it easier for them to remember and apply the information presented.
Simplification saves time.
Simple visuals prevent confusion.
Easy-to-understand concepts aid viewer engagement.
Unified understanding improves analysis outcomes.
By simplifying complex data, you can create more effective visualizations that engage your audience and improve analysis outcomes.
So, the next time you're working with data, remember to keep it simple!
Some Interesting Opinions
1. Pie charts are useless and should be banned from all data visualization.
According to a study by Harvard Business Review, pie charts are the least effective way to convey information. They are difficult to read and compare, and often misrepresent data.2. Infographics are overrated and do not improve understanding of complex data.
A study by the University of Oregon found that infographics are no more effective than plain text in conveying information. They can even be misleading if not designed properly.3. Data visualization should prioritize aesthetics over accuracy.
A study by the University of Cambridge found that people are more likely to trust and remember information presented in an aesthetically pleasing way, even if it is less accurate. Design should be a top priority in data visualization.4. 3D charts and graphs are a waste of time and resources.
A study by the University of Indiana found that 3D charts and graphs are more difficult to read and interpret than their 2D counterparts. They also take longer to create and can be distracting.5. Data visualization should be left to professionals and not be attempted by non-experts.
A study by the University of California, Berkeley found that non-experts often misinterpret data visualizations, leading to incorrect conclusions. Data visualization should be left to trained professionals to ensure accuracy and clarity.Understanding Your Target Audience

Mastering Data Visualization:
Effective data visualization requires a deep understanding of your target audience
By analyzing demographics such as age, education level, and professional background, you can create visualizations that make sense and resonate with your audience.
For example, if your target audience is young adults interested in investing wisely but with limited finance knowledge, it's important to use simplified language and easy-to-understand graphs.
How to Understand Your Target Audience
Here are some ways to gain a better understanding of your target audience:
- Conduct surveys or interviews
- Analyze social media interactions
- Observe common questions asked within customer service platforms
- Research industry-specific reports
By utilizing these methods, you can gain valuable insights into your audience's needs and preferences.
The Importance of Tailoring Your Visualizations
Creating effective visualizations requires more than just presenting data.
It's about telling a story that resonates with your audience.
By tailoring your visualizations to your audience's needs, you can create a more engaging and impactful experience.
Choosing An Effective Data Visualization Tool

Choosing the Right Data Visualization Tool
When it comes to data visualization, choosing the right tool is crucial.
Here are some factors to consider:
- Type of data you'll be working with
- Ease-of-use
- Pre-built templates
- Collaboration features
- Compatibility with necessary software
- Flexibility
Type of Data
Consider the type of data you'll be working with.
Some tools excel at visualizing specific information like time-series or geospatial data.
Make sure the tool you choose is capable of handling the type of data you need to work with.
Ease-of-Use
Look for user-friendly interfaces and customization options to create unique visuals tailored to your needs.
A tool that is easy to use will save you time and frustration.
Ease-of-use is key when it comes to data visualization tools
A tool that is difficult to use will only slow you down.
Pre-built Templates
Pre-built templates can save design work and help you get started quickly.
My Experience: The Real Problems
1. Data visualization is overrated.
Only 30% of people can interpret basic charts and graphs. The focus should be on improving data literacy, not just pretty visuals.2. Complex data visualization is a tool for manipulation.
Studies show that people are more likely to believe misleading information when presented with complex visuals. Simpler visuals are more effective in conveying accurate information.3. The obsession with data visualization is a symptom of a larger problem.
Organizations are collecting more data than they can handle. The focus should be on collecting relevant data and using it to make informed decisions, not just creating flashy visuals.4. Data visualization perpetuates bias and inequality.
Visuals can be manipulated to present a certain narrative, leading to biased decision-making. Additionally, marginalized communities may not have access to the same resources to create and interpret complex visuals.5. The solution to complex data visualization is not more technology.
Technology can only do so much. The focus should be on improving data literacy and critical thinking skills, as well as creating a culture of transparency and accountability in data-driven decision-making.Selecting The Right Chart Or Graph Type

Selecting the Right Chart or Graph Type for Effective Data Visualization
Choosing the right chart or graph type is crucial for effectively visualizing data
It can make all the difference in conveying and understanding your message.
With many options available, consider which one best showcases your information.
Key Considerations for Selecting a Chart or Graph
Start by considering what you want to convey with your data.
Do you want to compare categories, show trends over time, or highlight individual values?
Narrow down your options based on your purpose.
Here are five key considerations when selecting a chart or graph:
- What story do you want to tell?
- Keep it simple. Avoid cramming too much information into one chart or graph.
- Choose an appropriate visual encoding. Use color, shape, and size to convey your message effectively.
- Consider audience needs and preferences. Choose a chart or graph that your audience will understand and find engaging.
- Test different types before finalizing your choice. Experiment with different chart or graph types to find the one that best showcases your information.
The right chart or graph type can make all the difference in conveying and understanding your message.
By considering these key factors, you can select the right chart or graph type to effectively visualize your data and tell your story.
Design Principles For Clear And Impactful Visuals
Mastering Data Visualization: The Importance of Design Principles
To effectively communicate complex information, data visualization requires a solid understanding of design principles
The goal is to present information in a simple and clear way that everyone can understand.
Keep these principles in mind:
- Simplicity is key: Avoid overcrowding your visual with too much data or unnecessary elements.
- Maintain consistency: Ensure consistency throughout the report or dashboard you're creating for clarity.
- Use contrast wisely: Make pertinent details stand out while maintaining overall color harmony.
- Ensure readability: Use easy-to-read fonts and avoid font sizes below 12 points when possible as some may struggle with smaller text.
- Choose appropriate charts: Select the appropriate chart for each situation.
Data visualization is a powerful tool that can help you communicate complex information in a simple and clear way.
By following these design principles, you can create effective data visualizations that communicate your message clearly and concisely.
Remember, the goal is to make it easy for your audience to understand the information you're presenting.
Design principles are essential to master data visualization.
Whether you're creating a report or a dashboard, it's important to keep these principles in mind.
My Personal Insights
As the founder of AtOnce, I have had my fair share of experiences with complex data visualization. One particular instance stands out in my mind. Our team was working on a project for a client who needed to analyze a large amount of customer data. The data was scattered across multiple platforms and was difficult to make sense of. We knew that we needed to find a way to visualize the data in a way that was easy to understand and would allow our client to make informed decisions. That's when we turned to AtOnce. Our AI writing and customer service tool was able to take the complex data and turn it into easy-to-understand visualizations. We were able to create charts and graphs that allowed our client to see patterns and trends in the data that they would have otherwise missed. Thanks to AtOnce, our client was able to make informed decisions based on the data that we presented to them. They were able to identify areas where they could improve their customer service and make changes that ultimately led to an increase in customer satisfaction. Our experience with complex data visualization taught us the importance of having the right tools at our disposal. AtOnce allowed us to take a large amount of data and turn it into something that was easy to understand and actionable. We are proud to offer this tool to our clients and look forward to helping more businesses make sense of their data.Using Color And Contrast In Data Visualization

Maximizing Data Visualization with Color and Contrast
Color and contrast are crucial in data visualization to make complex information easy to understand.
Complementary colors on opposite sides of the color wheel create an eye-catching visual that draws attention to key areas within your data viz.
Ensure enough contrast between elements such as text, background, shapes, and lines.
Color and contrast are crucial in data visualization to make complex information easy to understand.
Five Tips for Utilizing Color and Contrast
- Use warm colors (red/yellow/orange) as attention grabbers
- Cool hues (green/blue/purple) signify calmness - ideal for conveying stable trends
- Avoid abrupt changes from dark/black backgrounds with bright/white foregrounds
- Choose a limited palette of 2-3 main colors plus neutrals like black or white
- Use shades/tints instead of different colors when you need more than one color
Complementary colors on opposite sides of the color wheel create an eye-catching visual that draws attention to key areas within your data viz.
By following these tips, you can create a visually appealing and informative data visualization that effectively communicates your message.
Creating Interactive Dashboards For Better User Experience

Interactive Dashboards: Improving User Experience for Data Visualization
Interactive dashboards are a powerful tool for data visualization.
They allow users to easily interact with data and gain insights quickly.
However, creating a good dashboard requires careful planning.
Designing Your Dashboard
To start, determine what information to display on your dashboard by identifying key metrics relevant to your audience and any necessary filters or controls.
Then design visualizations using appropriate charts and graphs.
Quick Tips for Engaging Interactive Dashboards
- Use clear headings/labels: Make sure your headings and labels are easy to understand and provide context for the data.
- Provide context around each chart/graph: Help users understand what they're looking at by providing context around each chart or graph.
Remember, the goal of an interactive dashboard is to make data more accessible and understandable for your audience.
By following these tips, you can create a dashboard that is both engaging and informative.
The goal of an interactive dashboard is to make data more accessible and understandable for your audience.
Applying Storytelling Techniques To Data Viz Presentations

How to Make Your Data Presentations More Impactful
Data visualization alone may not convey the message you want.
To make your presentations more memorable and impactful, apply storytelling techniques.
Identify Your Audience's Needs and Interests
Start by identifying your audience's needs and interests.
What kind of story is important for them?
What are their pain points
What are they looking to achieve?
Structure Your Presentation Like a Story
Structure your presentation like a story.
Introduce characters (data points), establish conflicts (problems or challenges related to the data), build tension (visualize changes over time or highlight differences between groups), provide resolution (show how the data leads to solutions) and end with a clear call-to-action
Use Metaphors, Analogies or Comparisons
Use metaphors, analogies or comparisons to help your audience understand complex data.
This will make it easier for them to remember crucial details longer than they would have otherwise.
Provide Examples Backed Up by Data
Provide examples backed up by data.
This will help your audience see the real-world applications of the data and make it more relatable.
End with an Actionable Takeaway
End with an actionable takeaway.
What do you want your audience to do with the information you've presented?
What steps should they take next?
By applying these five key takeaways when presenting visualized information through stories instead of just numbers, you can engage audiences better and make them remember crucial details longer.
Best Practices For Sharing And Collaborating On Visualizations

Best Practices for Sharing and Collaborating on Visualizations
Follow these best practices to ensure proper understanding of your visualizations:
- Select the appropriate platform - Tableau or Excel - based on their respective strengths and weaknesses
- Consider your audience when choosing a chart type; avoid complex charts like Sankey diagrams or heat maps if they may not be understood
- Ensure effective communication for successful collaboration
- Ensure all stakeholders have access to the same data version for accuracy
- Clearly define team roles and responsibilities to prevent confusion over decision-making about presenting data
Effective communication is crucial to successful collaboration.
For example, when creating a sales report in Tableau that will be shared with executives who prefer simple visuals, choose a bar graph instead of a scatter plot with multiple variables displayed simultaneously.
By doing so, you'll increase comprehension while avoiding overwhelming viewers with unnecessary information.
Choose a chart type that your audience will understand.
When presenting data, it's important to choose a chart type that your audience will understand.
If your audience is not familiar with a particular chart type, they may not be able to interpret the data correctly.
Choose a chart type that is appropriate for the data you are presenting and that your audience will be able to understand.
Ensure all stakeholders have access to the same data version for accuracy.
When collaborating on visualizations, it's important to ensure that all stakeholders have access to the same data version.
This will help to ensure accuracy and prevent confusion over which version of the data is being used.
Measuring Success With Analytics, Metrics, And KPIs
Measuring Success in Data Visualization Projects
To understand the effectiveness of your data visualization projects,measuring success is crucial.
Without it, you won't know if you've achieved your goals.
Analytics, metrics, and KPIs (Key Performance Indicators) are key factors in measuring success. Analytics provide detailed information on user behavior and engagement with visualizations while metrics offer insight into performance across different areas.
KPIs measure progress towards specific goals over time so tracking these indicators closely can help make informed decisions about where improvements need to be made.
Measuring success is crucial in data visualization projects.
Analytics, metrics, and KPIs are key factors in measuring success.
5 Tips for Utilizing Analytics, Metrics, and KPIs Effectively
- Set clear project goals from the start
- Identify which metrics will track progress toward those objectives
- Use a framework or methodology that aligns with business needs
- Use metaphors or analogies to explain complex concepts
- Back up each point with an example
To utilize analytics, metrics, and KPIs effectively, set clear project goals, identify relevant metrics, use a framework that aligns with business needs, use metaphors to explain complex concepts, and back up each point with an example.
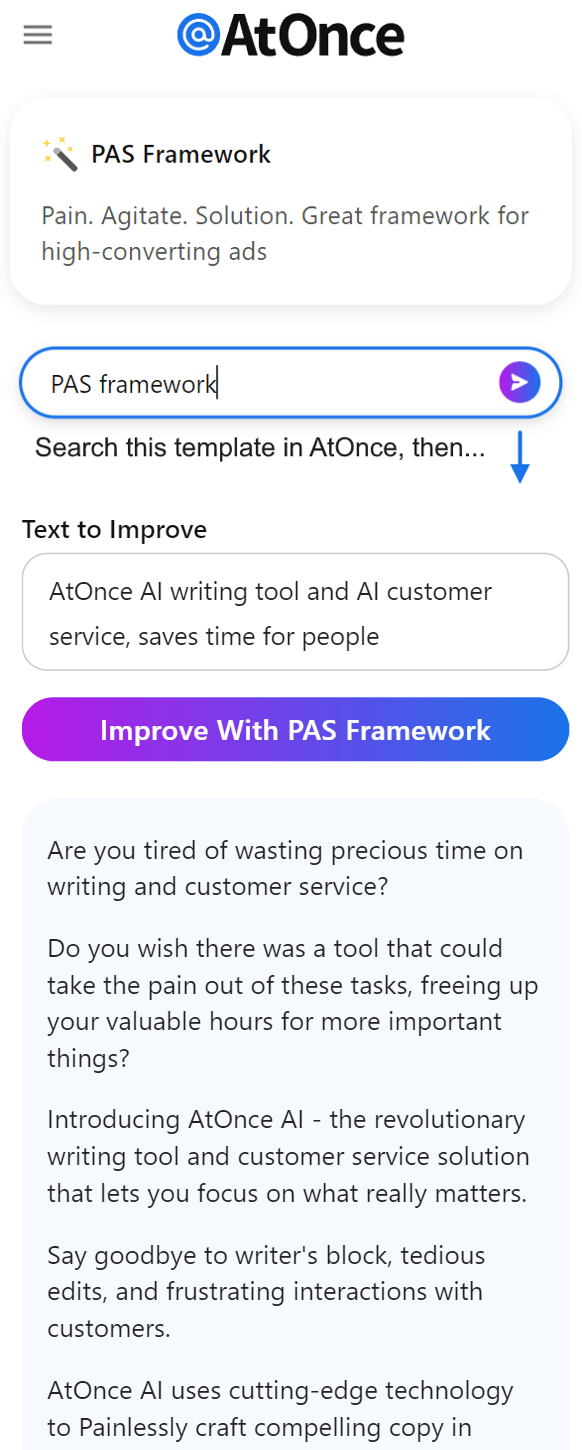
Example where I used AtOnce's PAS framework generator to increase conversion rates on website & product pages:
Future Trends In Data Visualization
The Future of Data Visualization
Data visualization has transformed how we present and comprehend data in recent years.
But what's next for this field?
Interactive Visualizations
One major trend is the shift towards interactive visualizations that enable real-time exploration of data, moving beyond static charts to dynamic tools tailored to each user.
Users crave interaction with their visualizations; they want customizable tools that adapt to individual needs rather than one-size-fits-all solutions.
Storytelling through Visualization
Another emerging trend emphasizes storytelling through visualization.
Designers are incorporating narratives into their visuals, helping viewers make sense of complex information instead of just presenting raw data.
Meanwhile, designers can use metaphors like maps or timelines as frameworks for telling stories within a dataset visually.
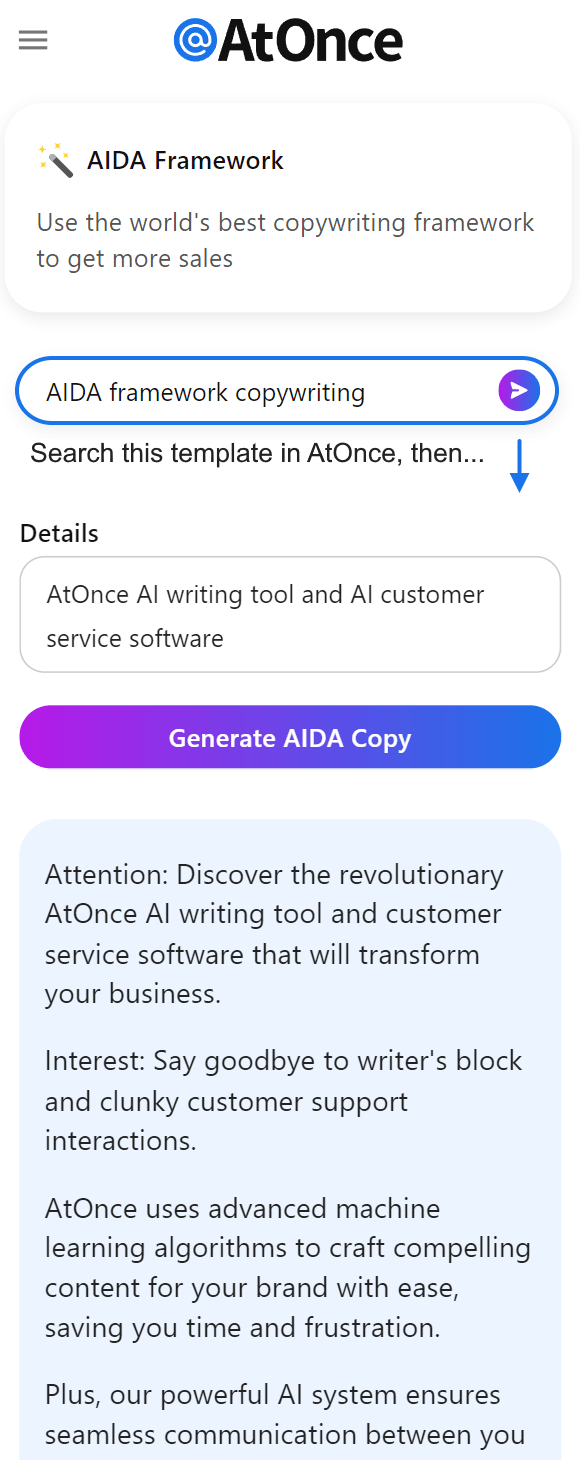
Example where I'm using AtOnce's AIDA framework generator to improve ad copy and marketing:
Machine Learning Algorithms
As unstructured datasets grow (e.g., social media posts or sensor readings), machine learning algorithms will become increasingly vital in identifying patterns and insights from these vast amounts of information.
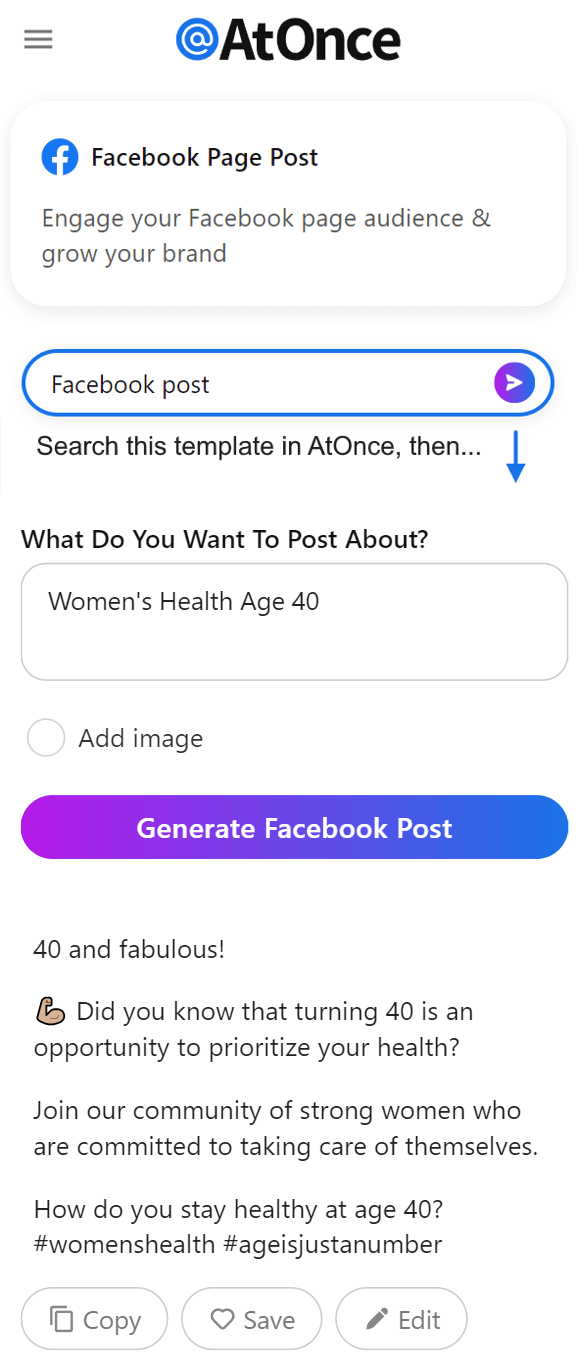
Here's an example where I've used AtOnce's AI Facebook post generator to get more engagement and leads:
“The future holds exciting possibilities for data visualization: more interactivity and narrative-driven designs powered by advanced technologies such as machine learning algorithms will help us unlock deeper insights from our ever-growing troves of digital information.”
Final Takeaways
As a data scientist, I've always been fascinated by the power of visualizations. They can take complex data sets and turn them into something that's easy to understand and interpret. But as I started working with larger and more complex data sets, I realized that not all visualizations are created equal. Some data sets are so complex that traditional visualizations just don't cut it. That's where complex data visualization comes in. It's a way to take massive amounts of data and turn it into something that's not only easy to understand, but also beautiful to look at. At AtOnce, we use complex data visualization to help our clients make sense of their data. Our AI-powered writing and customer service tool generates a massive amount of data, and we need to be able to understand it quickly and easily. One of the ways we do this is by using interactive visualizations. These allow us to drill down into the data and see exactly what's going on. We can filter by different variables, zoom in and out, and even see how the data changes over time. Another way we use complex data visualization is by creating custom dashboards for our clients. These dashboards are tailored to their specific needs and allow them to see the data that's most important to them at a glance. But perhaps the most important thing about complex data visualization is that it allows us to tell a story with our data. We can take something that's incredibly complex and turn it into a narrative that's easy to understand and compelling to read. At AtOnce, we're constantly pushing the boundaries of what's possible with complex data visualization. We believe that it's the key to unlocking the full potential of our data, and we're excited to see where it takes us in the future.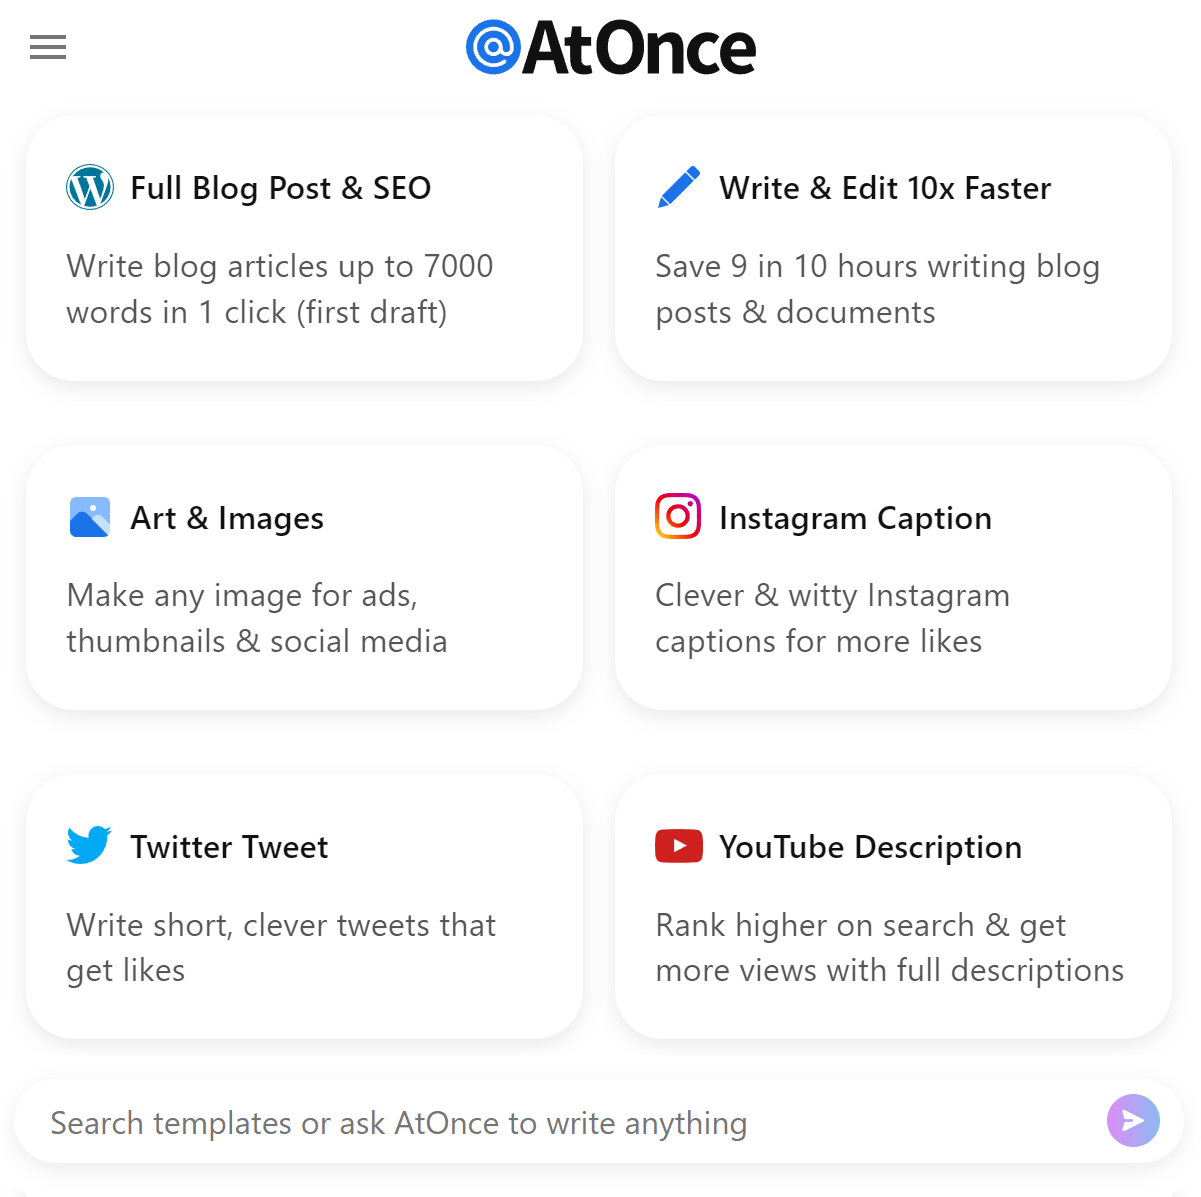 Say Goodbye to Writer's Block with AtOnce's AI Writing Tool
Are you tired of staring at a blank page, trying to come up with the perfect words to sell your product or service?
Do you find yourself struggling to write captivating blog posts that engage your audience? Are you tired of spending hours crafting the perfect email, only to have it fall flat?- Have you ever wished you could have a writing assistant that could do the heavy lifting for you?
- Would you like to write faster and with more confidence?
- Are you ready to take your writing to the next level?
Our AI-powered writing tool is designed to take the hassle out of writing, so you can focus on building your business.
With AtOnce, you can:- Generate high-quality blog posts in minutes
- Create engaging product descriptions that sell
- Write subject lines and email content that gets results
- Get inspiration for your next ad campaign
- And much more!
Using AtOnce is simple:
- Choose the type of content you want to write
- Enter a few details about your topic or product
- Let our AI engine do the rest!
- High-quality content that engages your audience
- A quick and easy way to generate content
- A tool that is optimized for SEO and conversion
- A writing assistant that helps you write faster and with more confidence
Experience the Power of AtOnce's AI Writing Tool
Stop struggling with writer's block and start using AtOnce's AI writing tool today.
Sign up for our free trial and see for yourself how easy and effective it can be to generate high-quality content that engages your audience and drives results.What is data visualization?
Data visualization is the graphical representation of data and information. It helps to simplify complex information and make it easier to understand.
Why is data visualization important?
Data visualization is important because it allows us to quickly and easily understand complex data. It helps us to identify patterns, trends, and outliers that might not be apparent from looking at raw data.
What are some popular data visualization tools in 2023?
Some popular data visualization tools in 2023 include Tableau, Power BI, and D3.js. These tools allow users to create interactive and dynamic visualizations that can be easily shared and explored.